Product has been added for comparison.
Voltage range:
Continous power:

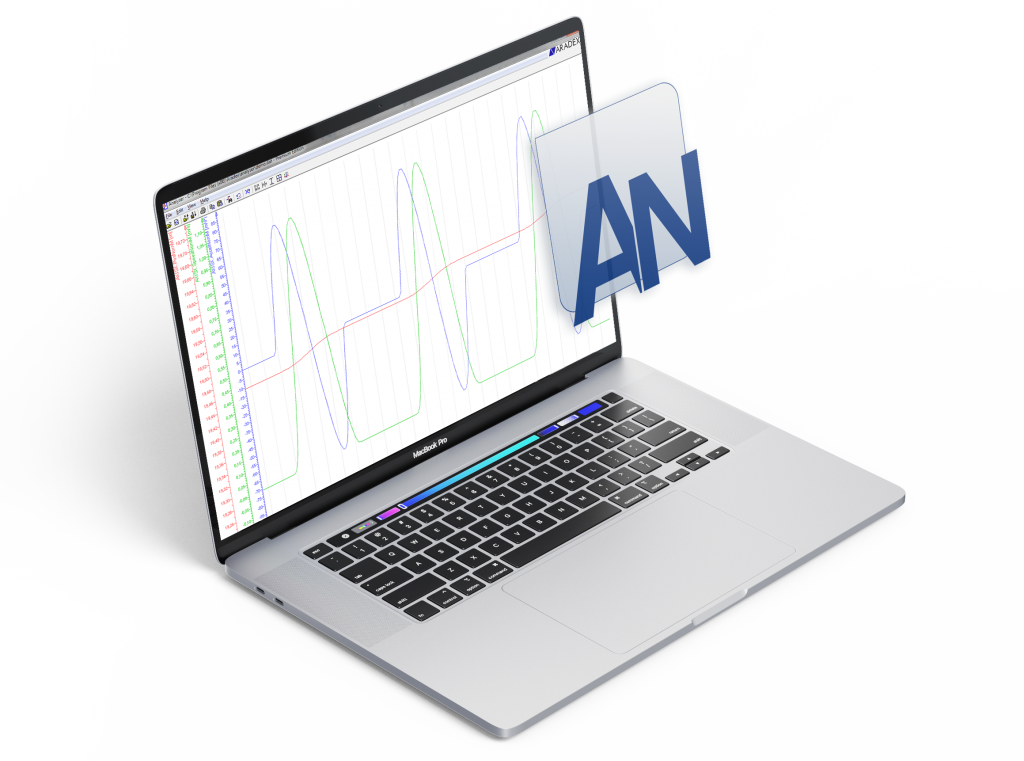
The ANALYSER is a software tool for displaying, evaluating, and documenting measurement series, e.g., from VECTOPOWER VP600 inverters or VP5000 DC/DC converters. The tool also has extensive import options, so that data from other devices can also be evaluated. The design of the ANALYSER is inspired by a digital storage oscilloscope and offers multi-channel support. The graphic display in the form of curves allows fast, intuitive comprehension of the measurement series.
No special knowledge required, can be used on ordinary PCs (Windows-based), intuitive use
Reading of all oscilloscope formats from ARADEX devices and import of different data formats such as csv, txt, etc.
Reading of CAN data files such as mf4, mfc, trc, log possible
Export of data in different formats and print function as png or svg
As an evaluation tool for previously acquired measurement data
Within VEConfig for direct tracking of rolling measurement data
Perfectly tailored for use with VECTOPOWER VP600 and VP5000 devices
Multi-channel display of several measured variables
The following data, among others, can be combined and evaluated using mathematical and statistical functions:
Own functions can be realized through the integration of Python
Thanks to convenient export functions, evaluations for reports and verifications can be created quickly and easily. The graphics can be optionally output as PNG or high-resolution SVG graphics. Results can be pasted into Office programs even faster via the clipboard.
All functions of the ANALYSER analysis software shown by license versions:
| Function | Base | Professional | CANPlus |
|---|---|---|---|
| Open and view the recorded data | X | X | X |
| Graphical diagnosis of data | X | X | X |
| Online connection to VEConfig | X | X | X |
| Mathematical functions | X | ||
| Export and print graphics | X | ||
| Import of non-analyzer data | X | ||
| Saving and exporting data | X | ||
| Own functions with Python | X | ||
| Direct reading of CAN data | X |
The ANALYSER is an easy-to-use and powerful diagnostic tool: